
Most property teams export a report from Yardi to Excel and then start the real work by hand: cleaning the rows, building pivots and charts, and explaining the numbers. Next month, the same work starts again.
What we change
PROP& enhances your Yardi reports so they come out as finished Excel dashboards. You do not get raw rows to analyse — you get the analysis, ready to present.
- A dashboard sheet with the headline KPIs, top tenants, aging buckets and trends.
- Master data sheets with the detail behind every number — tenants, leases, units and transactions — so anyone can drill down and check.
- Built-in data checks that flag missing collectors, missing CR numbers and duplicate VAT numbers on the sheet.
- Filters by property and collector, so each manager sees their own part of the portfolio.
Example: the collections dashboard
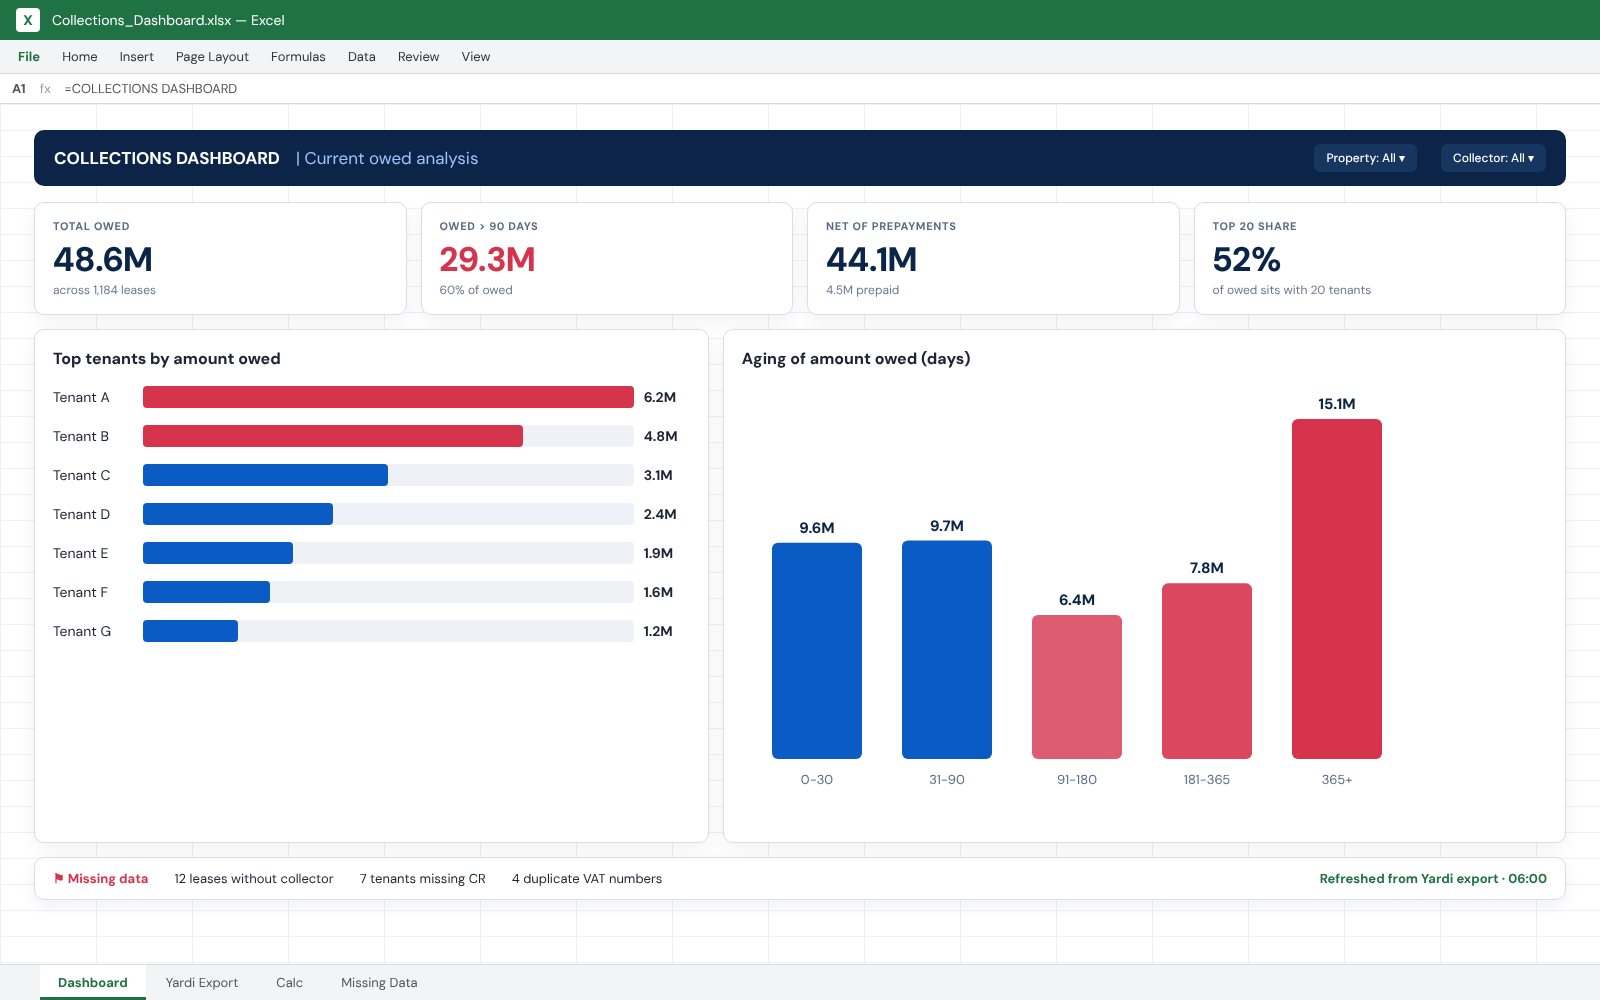
The picture above is an Excel collections dashboard built from a Yardi receivables report. On one sheet, finance sees the total owed, the amount over 90 days, the net after prepayments and the share owed by the top 20 tenants, with the top tenants and the aging chart beside them. The master data sheets behind it hold every tenant and lease, so each figure can be traced back to Yardi.
Refresh in minutes, not days
Next month, export the same Yardi report, refresh the workbook and the dashboard updates itself — same layout, same checks, no rebuilding. Your team spends its time on decisions, not on spreadsheets.
Where to start
Tell us which Yardi reports your team rebuilds every month. We usually start with collections, leasing and the rent roll, then extend to owner and management packs.
All figures in the picture are sample data.